

Earth Engine Tutorial #34: Interactive extraction of pixel values and interactive region reduction


This tutorial shows you how to extract pixel values from Earth Engine images interactively and save pixel values as a csv and shapefile. It will also show you how to perform interactive region reduction, which allows users to draw a rectangle or circle to compute descriptive statistics (e.g., mean, min, max, std, sum) of pixels within a user-drawn geometry. The region reduction results can be exported as a csv for shapefile.
Requirements
- geemap - A Python package for interactive mapping with Google Earth Engine, ipyleaflet, and ipywidgets
Installation
conda create -n gee python=3.7
conda activate gee
conda install mamba -c conda-forge
mamba install geemap -c conda-forge
Resources
Notebook:
Demo

Video
Step-by-step tutorial
Interactive extraction of pixel values
Import libraries
import os
import ee
import geemap
Create an interactive map
Map = geemap.Map()
Map
Add data to the map
landsat7 = ee.Image('LE7_TOA_5YEAR/1999_2003') \
    .select([0, 1, 2, 3, 4, 6])
landsat_vis = {
    'bands': ['B4', 'B3', 'B2'],
    'gamma': 1.4
}
Map.addLayer(landsat7, landsat_vis, "LE7_TOA_5YEAR/1999_2003")

Map.set_plot_options(add_marker_cluster=True)
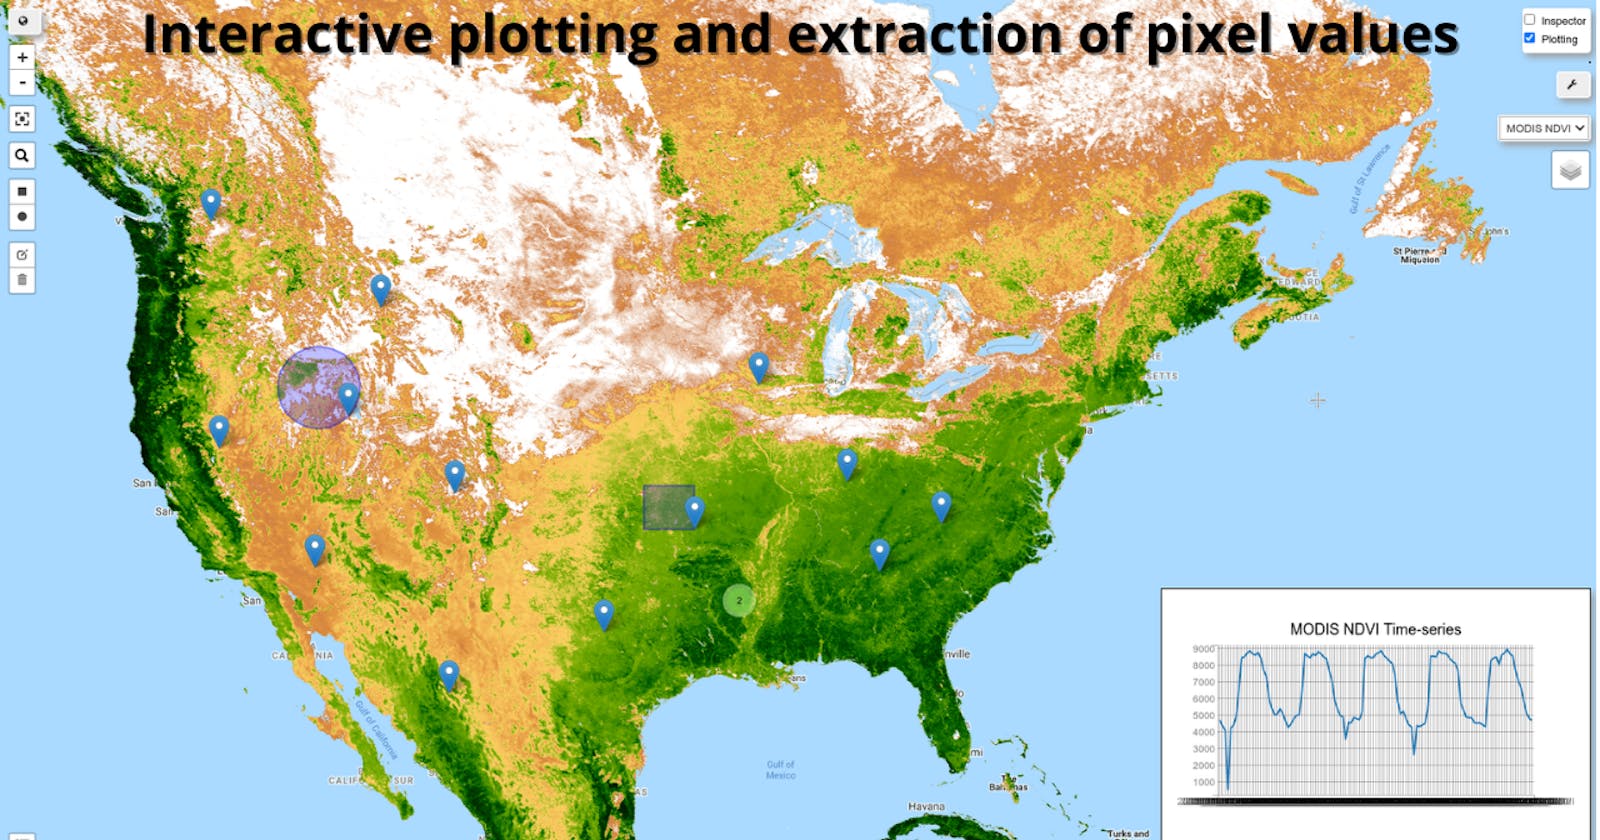
Activate the plotting tool
Tick the Plotting checkbox and click the mouse on the map to start displaying charts.
Export pixel values to shapefile/csv
out_dir = os.path.join(os.path.expanduser('~'), 'Downloads')
# out_csv = os.path.join(out_dir, 'points.csv')
out_shp = os.path.join(out_dir, 'points.shp')
Map.extract_values_to_points(out_shp)
Interactive Region Reduction
Import libraries
import os
import ee
import geemap
Create an interactive map
m = geemap.Map()
Add add to the map
collection = ee.ImageCollection('MODIS/006/MOD13A2') \
    .filterDate('2015-01-01', '2019-12-31') \
    .select('NDVI')

# Convert the image collection to an image.
image = collection.toBands()

ndvi_vis = {
  'min': 0.0,
  'max': 9000.0,
  'palette': [
    'FFFFFF', 'CE7E45', 'DF923D', 'F1B555', 'FCD163', '99B718', '74A901',
    '66A000', '529400', '3E8601', '207401', '056201', '004C00', '023B01',
    '012E01', '011D01', '011301'
  ]
}

m.addLayer(image, {}, 'MODIS NDVI Time-series')
m.addLayer(image.select(0), ndvi_vis, 'MODIS NDVI VIS')

m
Set reducer
m.set_plot_options(add_marker_cluster=True, marker=None)
m.roi_reducer = ee.Reducer.mean()
Export data
out_dir = os.path.join(os.path.expanduser('~'), 'Downloads')
# out_csv = os.path.join(out_dir, 'points.csv')
out_shp = os.path.join(out_dir, 'ndvi.shp')
m.extract_values_to_points(out_shp)