Earth Engine Tutorial #36: How to find out the greenest day of the year for each location
Published
•2 min read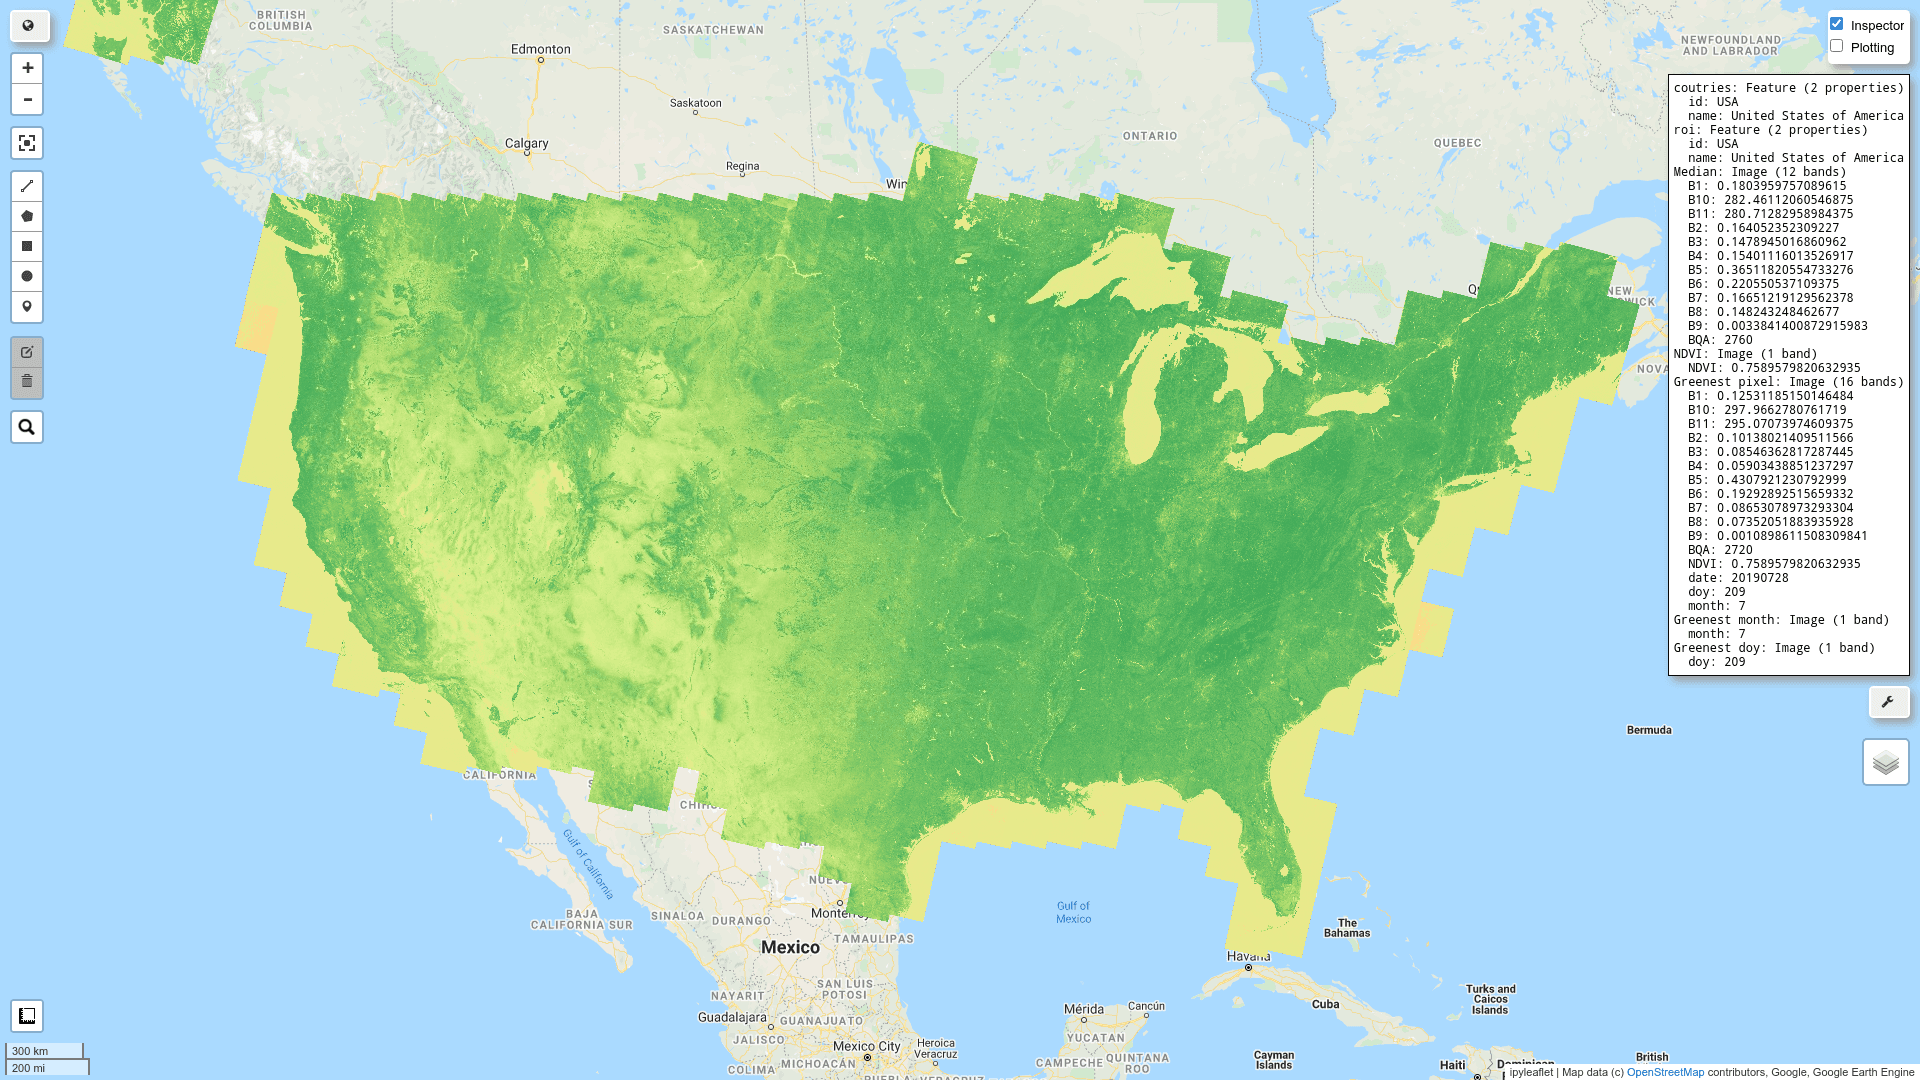
This tutorial shows you how to find out the greenest day of the year for each pixel location. The method can be generalized to find out the corresponding time of the maximum value of a timeseries for each pixel, such as the day with the hottest temperature record for each location during the past decades, the day with the largest amount of rainfall for each location during the past year.
Requirements
- geemap - A Python package for interactive mapping with Google Earth Engine, ipyleaflet, and ipywidgets
Installation
conda create -n gee python
conda activate gee
conda install mamba -c conda-forge
mamba install geemap -c conda-forge
Resources
Notebook:
- https://github.com/giswqs/geemap/blob/master/examples/notebooks/36_quality_mosaic.ipynb
Demo

Video
Step-by-step tutorial
Import libraries
import ee
import geemap
Create an interactive map
Map = geemap.Map()
Map
Define a region of interest (ROI)
countries = ee.FeatureCollection('users/giswqs/public/countries')
Map.addLayer(countries, {}, 'coutries')
roi = countries.filter(ee.Filter.eq('id', 'USA'))
Map.addLayer(roi, {}, 'roi')
Filter ImageCollection
start_date = '2019-01-01'
end_date = '2019-12-31'

l8 = ee.ImageCollection('LANDSAT/LC08/C01/T1_TOA') \
    .filterBounds(roi) \
    .filterDate(start_date, end_date)
Create a median composite
median = l8.median()

visParams = {
  'bands': ['B4', 'B3', 'B2'],
  'min': 0,
  'max': 0.4,
}

Map.addLayer(median, visParams, 'Median')
Define functions to add time bands
def addNDVI(image):
    ndvi = image.normalizedDifference(['B5', 'B4']).rename('NDVI')
    return image.addBands(ndvi)
def addDate(image):
    img_date = ee.Date(image.date())
    img_date = ee.Number.parse(img_date.format('YYYYMMdd'))
    return image.addBands(ee.Image(img_date).rename('date').toInt())
def addMonth(image):
    img_date = ee.Date(image.date())
    img_doy = ee.Number.parse(img_date.format('M'))
    return image.addBands(ee.Image(img_doy).rename('month').toInt())
def addDOY(image):
    img_date = ee.Date(image.date())
    img_doy = ee.Number.parse(img_date.format('D'))
    return image.addBands(ee.Image(img_doy).rename('doy').toInt())
Map over an ImageCollection
withNDVI = l8.map(addNDVI).map(addDate).map(addMonth).map(addDOY)
Create a quality mosaic
greenest = withNDVI.qualityMosaic('NDVI')
Display the max value band
ndvi = greenest.select('NDVI')
palette = ['#d73027', '#f46d43', '#fdae61', '#fee08b', '#d9ef8b', '#a6d96a', '#66bd63', '#1a9850']
Map.addLayer(ndvi, {'palette': palette}, 'NDVI')
Map.addLayer(greenest, visParams, 'Greenest pixel')
Map
Display time bands
Map.addLayer(greenest.select('month'), {'palette': ['red', 'blue'], 'min': 1, 'max': 12}, 'Greenest month')
Map.addLayer(greenest.select('doy'), {'palette': ['brown', 'green'], 'min': 1, 'max': 365}, 'Greenest doy')