

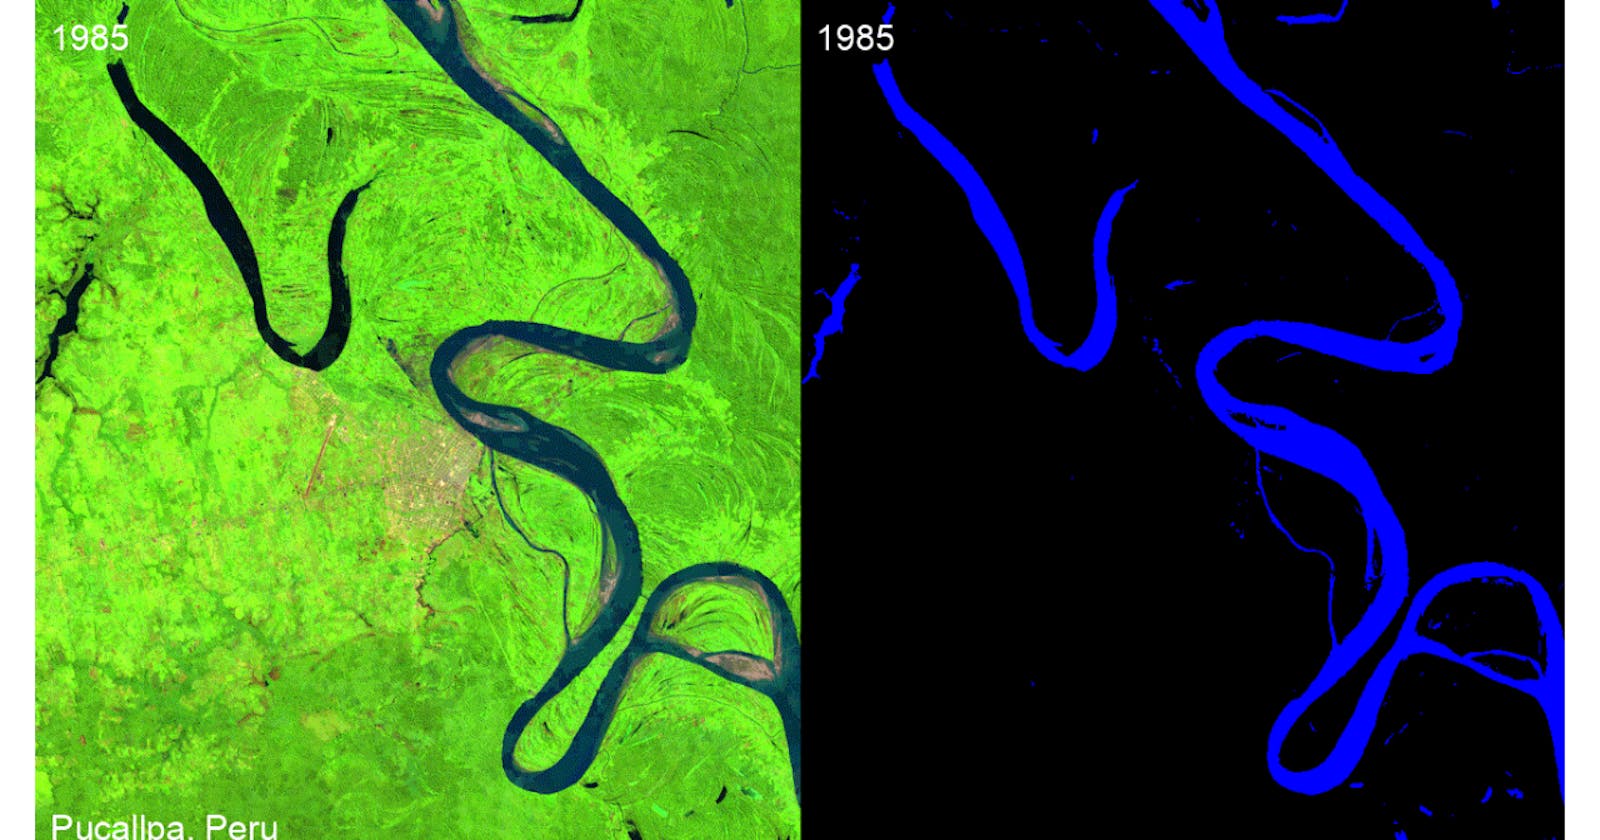


This tutorial shows you how to create timelapse animations of Landsat imagery and normalized difference indices (e.g., NDVI, NDWI) using Earth Engine and geemap.
Steps to create a Landsat timelapse:
- Pan and zoom to your area of interest, or click the globe icon at the upper left corner to search for a location.
- Use the drawing tool to draw a rectangle anywhere on the map.
- Adjust the parameters (e.g., start year, end year, title) if needed.
- Click the
Create timelapsebutton to create a timelapse. - Once the timelapse has been added to the map, click the hyperlink at the end if you want to download the GIF.
Web Apps: gishub.org/timelapse, gishub.org/gee-ngrok
Notebook: github.com/giswqs/geemap/blob/master/exampl..
Demo:
YouTube:
Source Code:
import os
import ee
import geemap
import ipywidgets as widgets
Map = geemap.Map()
Map.add_basemap('HYBRID')
Map
style = {'description_width': 'initial'}
title = widgets.Text(
    description='Title:',
    value='Landsat Timelapse',
    width=200,
    style=style
)

bands = widgets.Dropdown(
    description='Select RGB Combo:',
    options=['Red/Green/Blue', 'NIR/Red/Green',  'SWIR2/SWIR1/NIR', 'NIR/SWIR1/Red','SWIR2/NIR/Red',
             'SWIR2/SWIR1/Red', 'SWIR1/NIR/Blue', 'NIR/SWIR1/Blue', 'SWIR2/NIR/Green', 'SWIR1/NIR/Red'],
    value='NIR/Red/Green',
    style=style
)

hbox1 = widgets.HBox([title, bands])
hbox1
speed = widgets.IntSlider(
    description='  Frames per second:',
    tooltip='Frames per second:',
    value=10,
    min=1,
    max = 30,
    style=style
)

cloud = widgets.Checkbox(
    value=True,
    description='Apply fmask (remove clouds, shadows, snow)',
    style=style
)

hbox2 = widgets.HBox([speed, cloud])
hbox2
start_year = widgets.IntSlider(description='Start Year:', value=1984, min=1984, max=2020, style=style)
end_year = widgets.IntSlider(description='End Year:', value=2020, min=1984, max=2020, style=style)
start_month = widgets.IntSlider(description='Start Month:', value=5, min=1, max=12, style=style)
end_month = widgets.IntSlider(description='End Month:', value=10, min=1, max=12, style=style)
hbox3 = widgets.HBox([start_year, end_year, start_month, end_month])
hbox3
font_size = widgets.IntSlider(description='Font size:', value=30, min=10, max=50, style=style)

font_color = widgets.ColorPicker(
    concise=False,
    description='Font color:',
    value='white',
    style=style
)

progress_bar_color = widgets.ColorPicker(
    concise=False,
    description='Progress bar color:',
    value='blue',
    style=style
)

hbox4 = widgets.HBox([font_size, font_color, progress_bar_color])
hbox4
# Normalized Satellite Indices: https://www.usna.edu/Users/oceano/pguth/md_help/html/norm_sat.htm

nd_options = ['Vegetation Index (NDVI)',
              'Water Index (NDWI)',
              'Modified Water Index (MNDWI)',
              'Snow Index (NDSI)',
              'Soil Index (NDSI)',
              'Burn Ratio (NBR)',
              'Customized']
nd_indices = widgets.Dropdown(options=nd_options, value=None, description='Normalized Difference Index:', style=style)

first_band = widgets.Dropdown(
    description='1st band:',
    options=['Blue', 'Green','Red','NIR', 'SWIR1', 'SWIR2'],
    value=None,
    style=style
)

second_band = widgets.Dropdown(
    description='2nd band:',
    options=['Blue', 'Green','Red','NIR', 'SWIR1', 'SWIR2'],
    value=None,
    style=style
)

nd_threshold = widgets.FloatSlider(
    value=0,
    min=-1,
    max=1,
    step=0.01,
    description='Threshold:',
    orientation='horizontal',
)

nd_color = widgets.ColorPicker(
    concise=False,
    description='Color:',
    value='blue',
    style=style
)

def nd_index_change(change):
    if nd_indices.value == 'Vegetation Index (NDVI)':
        first_band.value = 'NIR'
        second_band.value = 'Red'
    elif nd_indices.value == 'Water Index (NDWI)':
        first_band.value = 'NIR'
        second_band.value = 'SWIR1'
    elif nd_indices.value == 'Modified Water Index (MNDWI)':
        first_band.value = 'Green'
        second_band.value = 'SWIR1'
    elif nd_indices.value == 'Snow Index (NDSI)':
        first_band.value = 'Green'
        second_band.value = 'SWIR1'
    elif nd_indices.value == 'Soil Index (NDSI)':
        first_band.value = 'SWIR1'
        second_band.value = 'NIR'
    elif nd_indices.value == 'Burn Ratio (NBR)':
        first_band.value = 'NIR'
        second_band.value = 'SWIR2'
    elif nd_indices.value == 'Customized':
        first_band.value = None
        second_band.value = None

nd_indices.observe(nd_index_change, names='value')

hbox5 = widgets.HBox([nd_indices, first_band, second_band, nd_threshold, nd_color])
hbox5
create_gif = widgets.Button(
    description='Create timelapse',
    button_style='primary',
    tooltip='Click to create timelapse',
    style=style
)

download_gif = widgets.Button(
    description='Download GIF',
    button_style='primary',
    tooltip='Click to download timelapse',
    disabled=False,
    style=style
)

output = widgets.Output()

hbox5 = widgets.HBox([create_gif])
hbox5
def submit_clicked(b):

    with output:
        output.clear_output()
        if start_year.value > end_year.value:
            print('The end year must be great than the start year.')
            return
        if start_month.value > end_month.value:
            print('The end month must be great than the start month.')
            return
        if start_year.value == end_year.value:
            add_progress_bar = False
        else:
            add_progress_bar = True

        start_date = str(start_month.value).zfill(2) + '-01'
        end_date = str(end_month.value).zfill(2) + '-30'

        print('Computing...')

        nd_bands = None
        if (first_band.value is not None) and (second_band.value is not None):
            nd_bands = [first_band.value, second_band.value]

        Map.add_landsat_ts_gif(roi=Map.user_roi, label=title.value, start_year=start_year.value,
                               end_year=end_year.value, start_date=start_date, end_date=end_date,
                               bands=bands.value.split('/'), font_color=font_color.value,
                               frames_per_second=speed.value, font_size=font_size.value,
                               add_progress_bar= add_progress_bar, progress_bar_color=progress_bar_color.value,
                               download=True, apply_fmask=cloud.value, nd_bands=nd_bands,
                               nd_threshold=nd_threshold.value, nd_palette=['black', nd_color.value])

create_gif.on_click(submit_clicked)
output