

GEE Tutorial #41 - How to develop an Earth Engine app for mapping surface water dynamics


This tutorials shows you how to develop an Earth Engine app for mapping landscape changes (e.g., surface water, vegetation, urban).
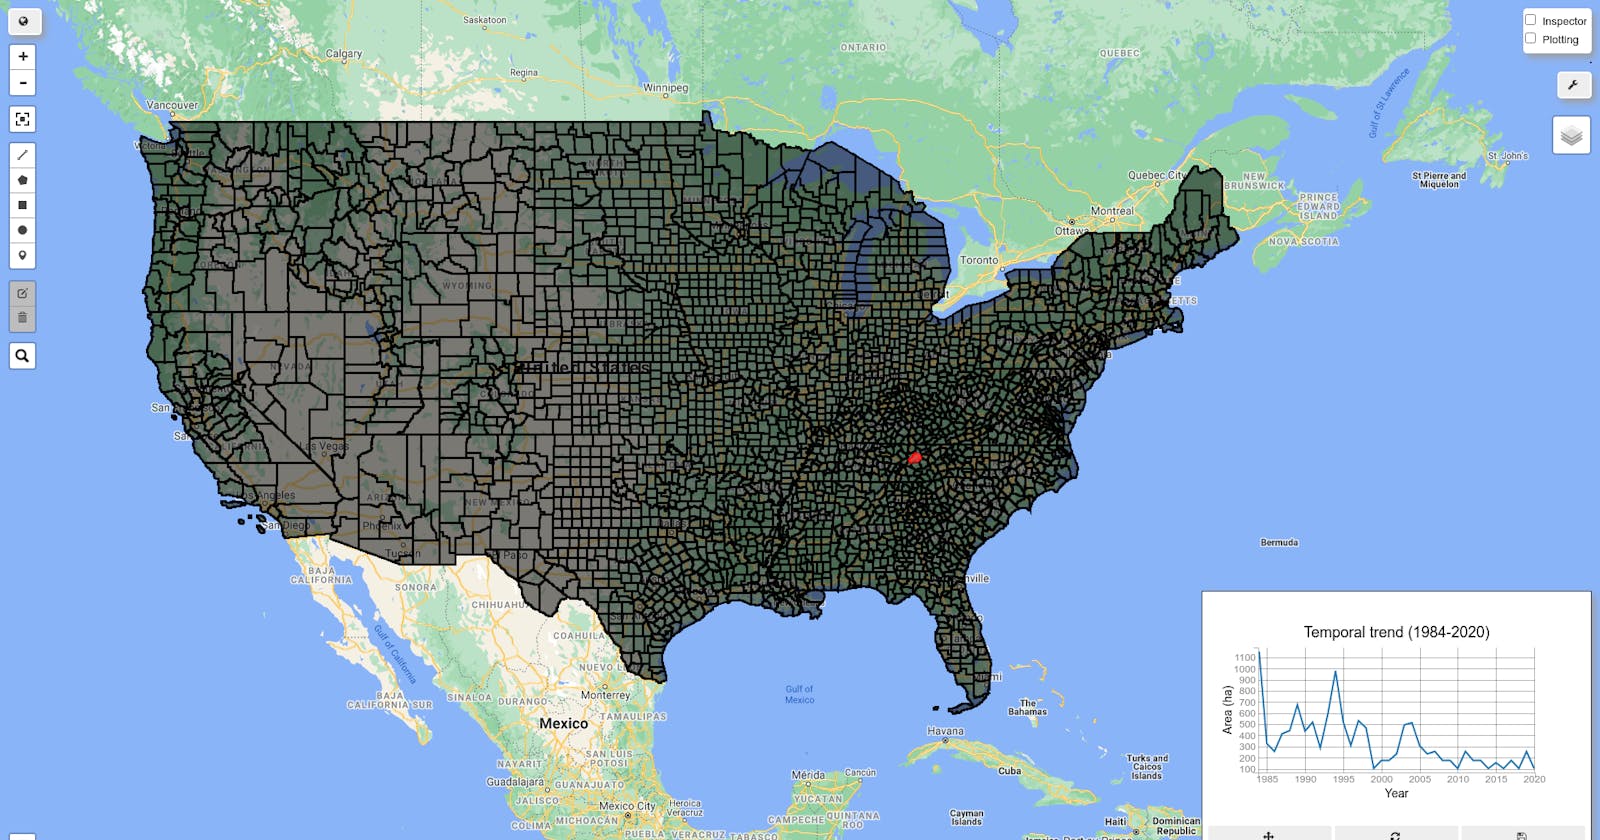
Steps to create Landsat timeseries:
- Pan and zoom to your area of interest (AOI), and click on the map to select a polygon. Alternatively, you can enable
Use user-drawn AOIand use the Drawing tools (e.g., rectange) to draw a shape on the map. - Adjust the parameters (e.g., band combination, threshold, color, download chart data) if needed.
- Click the
Submitbutton to create timeseries of Landsat imagery and normalized difference indices.
Web Apps: gishub.org/water-app, gishub.org/water-ngrok
GitHub: github.com/giswqs/geemap
Notebook: github.com/giswqs/geemap/blob/master/exampl..
Demo:

YouTube:
Source code:
# Check geemap installation
import subprocess

try:
    import geemap
except ImportError:
    print('geemap package is not installed. Installing ...')
    subprocess.check_call(["python", '-m', 'pip', 'install', 'geemap'])
# Import libraries
import os
import ee
import geemap
import ipywidgets as widgets
from bqplot import pyplot as plt
from ipyleaflet import WidgetControl
# Create an interactive map
Map = geemap.Map(center=[40, -100], zoom=4, add_google_map=False)
Map.add_basemap('HYBRID')
Map.add_basemap('ROADMAP')

# Add Earth Engine data
fc = ee.FeatureCollection('TIGER/2018/Counties')
Map.addLayer(fc, {}, 'US Counties')

states = ee.FeatureCollection('TIGER/2018/States')
# Map.addLayer(states, {}, 'US States')

Map
# Designe interactive widgets

style = {'description_width': 'initial'}

output_widget = widgets.Output(layout={'border': '1px solid black'})
output_control = WidgetControl(widget=output_widget, position='bottomright')
Map.add_control(output_control)

admin1_widget = widgets.Text(
    description='State:',
    value='Tennessee',
    width=200,
    style=style
)

admin2_widget = widgets.Text(
    description='County:',
    value='Knox',
    width=300,
    style=style
)

aoi_widget = widgets.Checkbox(
    value=False,
    description='Use user-drawn AOI',
    style=style
)

download_widget = widgets.Checkbox(
    value=False,
    description='Download chart data',
    style=style
)

def aoi_change(change):
    Map.layers = Map.layers[:4]
    Map.user_roi = None
    Map.user_rois = None
    Map.draw_count = 0
    admin1_widget.value = ''
    admin2_widget.value = ''
    output_widget.clear_output()

aoi_widget.observe(aoi_change, names='value')

band_combo = widgets.Dropdown(
    description='Band combo:',
    options=['Red/Green/Blue', 'NIR/Red/Green',  'SWIR2/SWIR1/NIR', 'NIR/SWIR1/Red','SWIR2/NIR/Red',
             'SWIR2/SWIR1/Red', 'SWIR1/NIR/Blue', 'NIR/SWIR1/Blue', 'SWIR2/NIR/Green', 'SWIR1/NIR/Red'],
    value='NIR/Red/Green',
    style=style
)

year_widget = widgets.IntSlider(min=1984, max=2020, value=2010, description='Selected year:', width=400, style=style)

fmask_widget = widgets.Checkbox(
    value=True,
    description='Apply fmask(remove cloud, shadow, snow)',
    style=style
)


# Normalized Satellite Indices: https://www.usna.edu/Users/oceano/pguth/md_help/html/norm_sat.htm

nd_options = ['Vegetation Index (NDVI)',
              'Water Index (NDWI)',
              'Modified Water Index (MNDWI)',
              'Snow Index (NDSI)',
              'Soil Index (NDSI)',
              'Burn Ratio (NBR)',
              'Customized']
nd_indices = widgets.Dropdown(options=nd_options, value='Modified Water Index (MNDWI)', description='Normalized Difference Indes:', style=style)

first_band = widgets.Dropdown(
    description='1st band:',
    options=['Blue', 'Green','Red','NIR', 'SWIR1', 'SWIR2'],
    value='Green',
    style=style
)

second_band = widgets.Dropdown(
    description='2nd band:',
    options=['Blue', 'Green','Red','NIR', 'SWIR1', 'SWIR2'],
    value='SWIR1',
    style=style
)

nd_threshold = widgets.FloatSlider(
    value=0,
    min=-1,
    max=1,
    step=0.01,
    description='Threshold:',
    orientation='horizontal',
    style=style
)

nd_color = widgets.ColorPicker(
    concise=False,
    description='Color:',
    value='blue',
    style=style
)

def nd_index_change(change):
    if nd_indices.value == 'Vegetation Index (NDVI)':
        first_band.value = 'NIR'
        second_band.value = 'Red'
    elif nd_indices.value == 'Water Index (NDWI)':
        first_band.value = 'NIR'
        second_band.value = 'SWIR1'
    elif nd_indices.value == 'Modified Water Index (MNDWI)':
        first_band.value = 'Green'
        second_band.value = 'SWIR1'
    elif nd_indices.value == 'Snow Index (NDSI)':
        first_band.value = 'Green'
        second_band.value = 'SWIR1'
    elif nd_indices.value == 'Soil Index (NDSI)':
        first_band.value = 'SWIR1'
        second_band.value = 'NIR'
    elif nd_indices.value == 'Burn Ratio (NBR)':
        first_band.value = 'NIR'
        second_band.value = 'SWIR2'
    elif nd_indices.value == 'Customized':
        first_band.value = None
        second_band.value = None

nd_indices.observe(nd_index_change, names='value')

submit = widgets.Button(
    description='Submit',
    button_style='primary',
    tooltip='Click me',
    style=style
)

full_widget = widgets.VBox([
    widgets.HBox([admin1_widget, admin2_widget, aoi_widget, download_widget]),
    widgets.HBox([band_combo, year_widget, fmask_widget]),
    widgets.HBox([nd_indices, first_band, second_band, nd_threshold, nd_color]),
    submit
])

full_widget
# Capture user interaction with the map

def handle_interaction(**kwargs):
    latlon = kwargs.get('coordinates')
    if kwargs.get('type') == 'click' and not aoi_widget.value:
        Map.default_style = {'cursor': 'wait'}
        xy = ee.Geometry.Point(latlon[::-1])
        selected_fc = fc.filterBounds(xy)

        with output_widget:
            output_widget.clear_output()

            try:
                feature = selected_fc.first()
                admin2_id = feature.get('NAME').getInfo()
                statefp = feature.get('STATEFP')
                admin1_fc = ee.Feature(states.filter(ee.Filter.eq('STATEFP', statefp)).first())
                admin1_id = admin1_fc.get('NAME').getInfo()
                admin1_widget.value = admin1_id
                admin2_widget.value = admin2_id
                Map.layers = Map.layers[:4]
                geom = selected_fc.geometry()
                layer_name = admin1_id + '-' + admin2_id
                Map.addLayer(ee.Image().paint(geom, 0, 2), {'palette': 'red'}, layer_name)
                print(layer_name)
            except:
                print('No feature could be found')
                Map.layers = Map.layers[:4]

        Map.default_style = {'cursor': 'pointer'}
    else:
        Map.draw_count = 0

Map.on_interaction(handle_interaction)
# Click event handler

def submit_clicked(b):

    with output_widget:
        output_widget.clear_output()
        print('Computing...')
        Map.default_style = {'cursor': 'wait'}

        try:
            admin1_id = admin1_widget.value
            admin2_id = admin2_widget.value
            band1 = first_band.value
            band2 = second_band.value
            selected_year = year_widget.value
            threshold = nd_threshold.value
            bands = band_combo.value.split('/')
            apply_fmask = fmask_widget.value
            palette = nd_color.value
            use_aoi = aoi_widget.value
            download = download_widget.value

            if use_aoi:
                if Map.user_roi is not None:
                    roi = Map.user_roi
                    layer_name = 'User drawn AOI'
                    geom = roi
                else:
                    output_widget.clear_output()
                    print('No user AOI could be found.')
                    return
            else:

                statefp = ee.Feature(states.filter(ee.Filter.eq('NAME', admin1_id)).first()).get('STATEFP')
                roi = fc.filter(ee.Filter.And(ee.Filter.eq('NAME', admin2_id), ee.Filter.eq('STATEFP', statefp)))
                layer_name = admin1_id + '-' + admin2_id
                geom = roi.geometry()


            Map.layers = Map.layers[:4]
            Map.addLayer(ee.Image().paint(geom, 0, 2), {'palette': 'red'}, layer_name)

            images = geemap.landsat_timeseries(roi=roi, start_year=1984, end_year=2020, start_date='01-01', end_date='12-31', apply_fmask=apply_fmask)
            nd_images = images.map(lambda img: img.normalizedDifference([band1, band2]))
            result_images = nd_images.map(lambda img: img.gt(threshold))

            selected_image = ee.Image(images.toList(images.size()).get(selected_year - 1984))
            selected_result_image = ee.Image(result_images.toList(result_images.size()).get(selected_year - 1984)).selfMask()

            vis_params = {
                'bands': bands,
                'min': 0,
                'max': 3000
            }

            Map.addLayer(selected_image, vis_params, 'Landsat ' + str(selected_year))
            Map.addLayer(selected_result_image, {'palette': palette}, 'Result ' + str(selected_year))


            def cal_area(img):
                pixel_area = img.multiply(ee.Image.pixelArea()).divide(1e4)
                img_area = pixel_area.reduceRegion(**{
                    'geometry': geom,
                    'reducer': ee.Reducer.sum(),
                    'scale': 1000,
                    'maxPixels': 1e12,
                    'bestEffort': True
                })
                return img.set({'area': img_area})

            areas = result_images.map(cal_area)
            stats = areas.aggregate_array('area').getInfo()
            x = list(range(1984, 2021))
            y = [item.get('nd') for item in stats]

            fig = plt.figure(1)
            fig.layout.height = '270px'
            plt.clear()
            plt.plot(x, y)
            plt.title('Temporal trend (1984-2020)')
            plt.xlabel('Year')
            plt.ylabel('Area (ha)')

            output_widget.clear_output()

            plt.show()

            if download:
                out_dir = os.path.join(os.path.expanduser('~'), 'Downloads')
                out_name = 'chart_' + geemap.random_string() + '.csv'
                out_csv = os.path.join(out_dir, out_name)
                if not os.path.exists(out_dir):
                    os.makedirs(out_dir)
                with open(out_csv, 'w') as f:
                    f.write('year, area (ha)\n')
                    for index, item in enumerate(x):
                        line = '{},{:.2f}\n'.format(item, y[index])
                        f.write(line)
                link = geemap.create_download_link(
                    out_csv, title="Click here to download the chart data: ")
                display(link)

        except Exception as e:
            print(e)
            print('An error occurred during computation.')

        Map.default_style = {'cursor': 'default'}

submit.on_click(submit_clicked)