How to create timelapse animations of spectral indices (e.g., NDWI, NDVI)
Published
•1 min read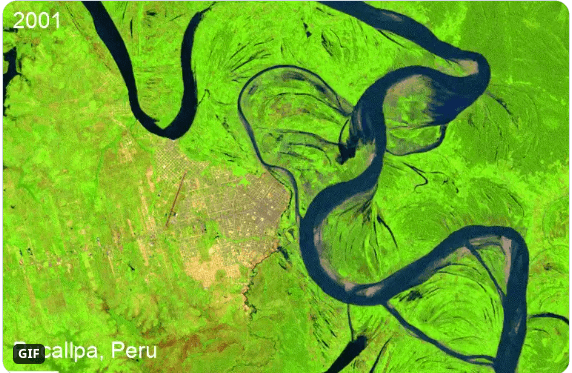
You can now use one line of code to create a Landsat timelapse of a normalized difference index (e.g., NDVI, NDWI) using Earth Engine and geemap. This option will be added to the Landsat timelapse web app soon.
Notebook: https://gist.github.com/giswqs/bab47213f0cbd3d1073ea47b01331c62
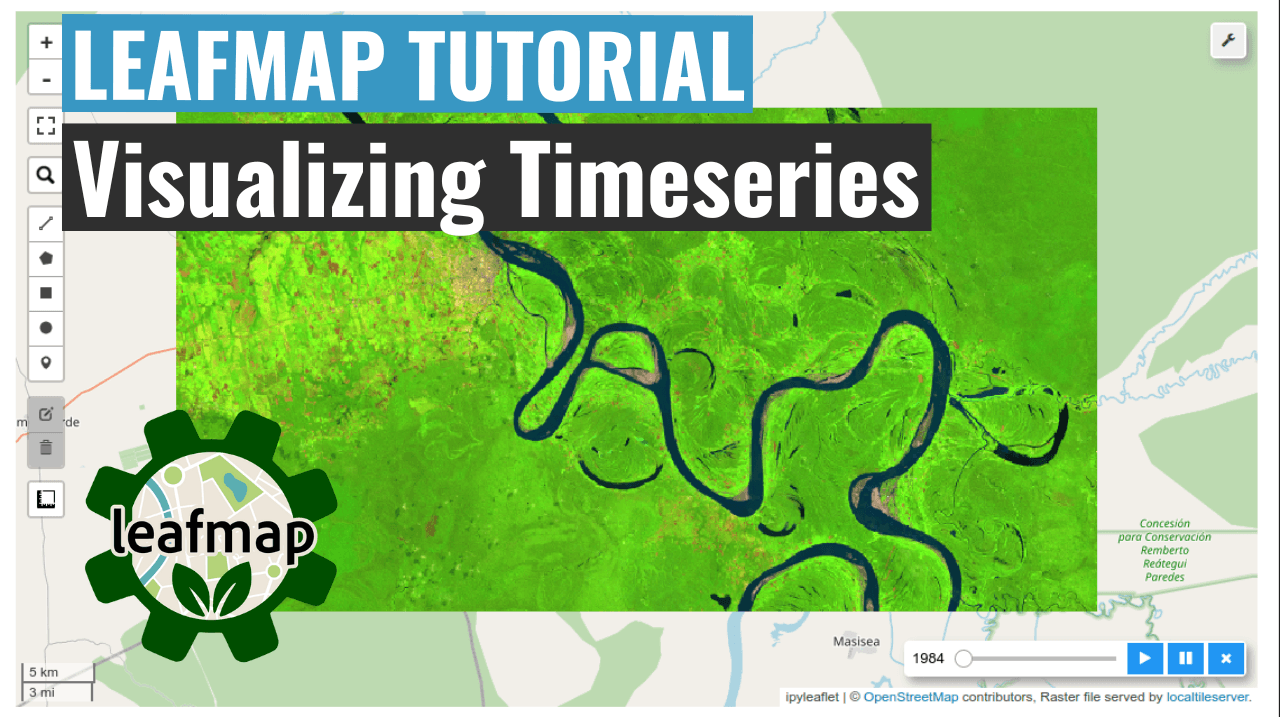
The original Landsat timelapse (band combination: SWIR1/NIR/Red)

Surface water area extracted using the Normalized Difference Water Index (NDWI)

Vegetation area extracted using the Normalized Difference Vegetation Index (NDVI)

Source code:
import ee
import geemap
Install the development version from GitHub
# geemap.update_package()
Map = geemap.Map()
Map
Use the Drawing Tools to draw a rectangle.
Map.setCenter(-74.520409, -8.373150, 12)
Map.add_landsat_ts_gif(label= 'Pucallpa, Peru', bands=['SWIR1', 'NIR', 'Red'], nd_bands=['NIR', 'Red'], nd_palette=['black', 'green'], nd_threshold=0.3, start_year=2000, start_date='01-01', end_date='12-31', frames_per_second=5)